Customer Segmentation Model
Background
The informative features in this dataset that tell us about customer buying behavior include "Quantity", "InvoiceDate" and "UnitPrice." Using these variables, we are going to derive a customer's RFM profile - Recency, Frequency, Monetary Value.
RFM is commonly used in marketing to evaluate a client's value based on their:
- Recency: How recently have they made a purchase?
- Frequency: How often have they bought something?
- Monetary Value: How much money do they spend on average when making purchases?
1. Calculating Recency
# convert date column to datetime format
df['Date']= pd.to_datetime(df['InvoiceDate'])
# keep only the most recent date of purchase
df['rank'] = df.sort_values(['CustomerID','Date']).groupby(['CustomerID'])['Date'].rank(method='min')
df_rec = df[df['rank']==1]
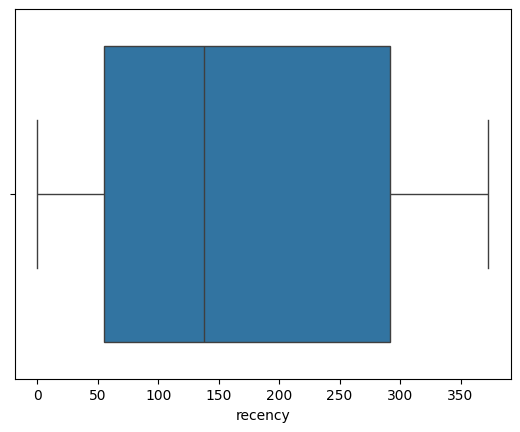
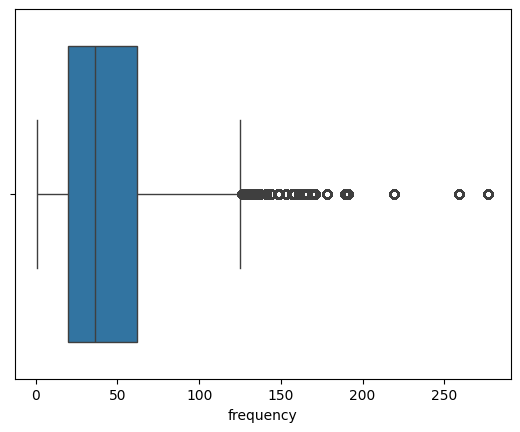
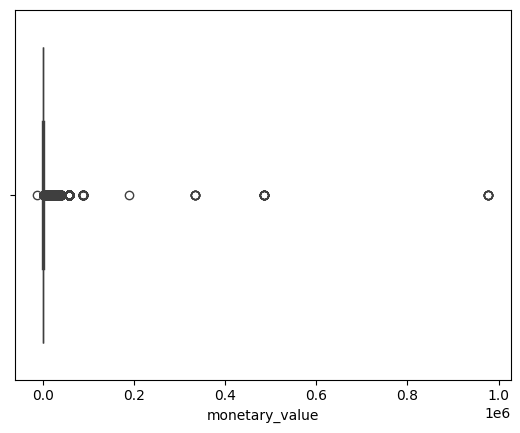
Removing Outliers
import seaborn as sns
import matplotlib.pyplot as plt
list1 = ['recency','frequency','monetary_value']
for i in list1:
    print(str(i)+': ')
    ax = sns.boxplot(x=finaldf[str(i)])
    plt.show()
Segmentation Model Interpretation and Visualization
pred = kmeans.predict(scaled_features)
frame = pd.DataFrame(new_df)
frame['cluster'] = pred

avg_df = frame.groupby(['cluster'], as_index=False).mean()
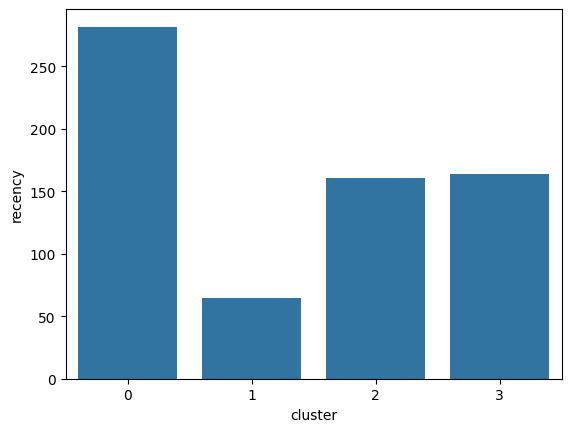
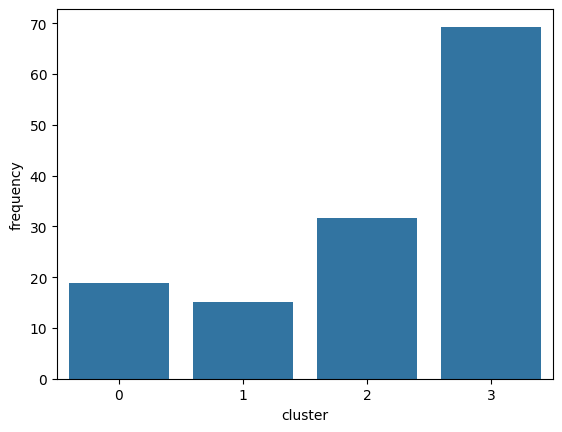
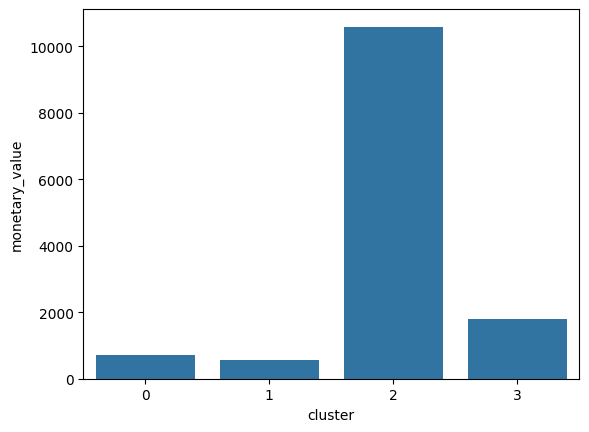
for i in list1:
    sns.barplot(x='cluster',y=str(i),data=avg_df)
    plt.show()
